Simple Linear Regression with Python#
In this notebook, we will use Python to implement a simple linear regression algorithm.
Load Libraries#
import numpy as np
import matplotlib.pyplot as plt
from scipy.stats import linregress
Enter the Data#
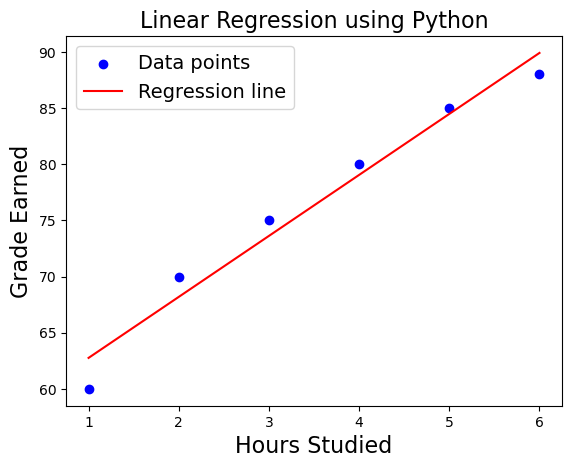
hours_studied = np.array([1, 2, 3, 4, 5, 6])
grades_earned = np.array([60, 70, 75, 80, 85, 88])
Perform Linear Regression Calculations#
slope, intercept, r_value, p_value, std_err = linregress(hours_studied, grades_earned)
Print Results#
print(f"Slope (Coefficient): {round(slope,3)}")
print(f"Intercept: {round(intercept,2)}")
Slope (Coefficient): 5.429
Intercept: 57.33
Plot Results#
plt.scatter(hours_studied, grades_earned, color='blue', label='Data points')
plt.plot(hours_studied, slope * hours_studied + intercept, color='red', label='Regression line')
plt.xlabel('Hours Studied', fontsize=16)
plt.ylabel('Grade Earned', fontsize=16)
plt.title('Linear Regression using Python', fontsize = 16)
plt.legend(fontsize=14)
plt.show()


